Detailing Website Speed: How to Test It and Make Your Site Load Fast on Phones
Why speed matters for detailers on phones, how to test it with Google's free tools, what Core Web Vitals mean in plain English, and a no-code checklist to make your site faster.


Detailing website speed is how quickly your page shows up, settles and responds when a customer opens it on their phone. You can check it for free in a couple of minutes with Google’s PageSpeed Insights, and on most detailing sites the biggest fix doesn’t involve code at all: it’s the before and after photos. Resize and compress them, cut the widgets you don’t need, and a slow site often becomes a reasonably fast one.
This guide explains why speed matters for a local service business, what Google’s Core Web Vitals measure in plain English, how to test your site with PageSpeed Insights and Search Console, and which no-code changes are worth your time: photos, lazy loading, fonts, widgets and hosting. You don’t need to become a developer. Where a fix needs your builder or host, we’ll say so. In our car detailing website study, the median homepage weighed 1.96 MB and 16% were over 5 MB, which drags page speed down on phones.
Need the website first? You can build a free car detailing website in a few minutes, with your packages, prices and a quote button, or start from a detailing template.
Why Detailing Website Speed Matters On Phones
Think about when people look for a detailer. They’re in a parking lot looking at bird droppings on the hood, on a lunch break, or on the couch after a road trip with the kids. They’re on a phone, often on mobile data, and they’re comparing you with two or three other detailers in other tabs. That’s the moment your detailing website speed gets tested.
Customers Compare You In Other Tabs
A customer with three detailers open in three tabs will give each one a few seconds. If your page shows a blank screen, then a jumpy layout, then a gallery that loads one photo at a time, they’ll flip to the tab that’s already showing prices and a call button. Nobody waits long on a phone for a service they can find somewhere else, so detailing website speed decides who gets looked at. Your work might be better, but they never get far enough to see it. Good page speed simply keeps you in the comparison.
The Enquiries You Never See
The people who leave a slow page won’t tell you why. They don’t call to complain, and they don’t show up in your inbox. That’s what makes a slow site expensive: you don’t see the enquiries you lose. It’s also why owners tend to underestimate the problem. Your own phone has the site cached, you test on home Wi-Fi, and everything looks fine. A first-time visitor on mobile data in a parking lot has a very different experience.
What Speed Means For Search
Speed also connects to search. Google’s page experience documentation says Core Web Vitals are used by its ranking systems, but it is just as clear that relevance comes first and that good scores alone don’t guarantee top results. So treat page speed as part of serving visitors well, not as a ranking trick. A fast page with weak content won’t outrank a helpful one. Our car detailing SEO guide covers the bigger local search picture.
Done-for-you websites
Want your website built for you?
ReadySite writes the wording, builds up to 5 pages and sets up your Google Business Profile. $299 one time, and you see a free preview before you pay.
Core Web Vitals In Plain English
Google measures a page’s real-world experience with three Core Web Vitals. You’ll see these names in PageSpeed Insights and Search Console, so it helps to know what each one means for a detailing site before you start changing things.
Largest Contentful Paint: How Fast The Main Thing Appears
Largest Contentful Paint, or LCP, measures how long it takes for the biggest visible item to show up. On a detailing homepage, that’s usually your hero photo or headline. Slow LCP usually means a heavy image or slow hosting. Google’s threshold for good is 2.5 seconds or less, needs improvement is up to 4 seconds, and anything over 4 seconds is poor. Check the size of your hero photo first, then whether a slider or heavy theme loads before it, then your hosting.
Interaction To Next Paint: How Fast The Page Reacts
Interaction to Next Paint, or INP, measures how quickly the page responds when someone taps. Tap “Menu,” “Call” or a gallery arrow: does something happen right away, or is there a lag? Good is 200 milliseconds or less, needs improvement is up to 500, and over 500 is poor. Heavy scripts and widgets are the usual cause. Look at chat widgets, booking embeds, social feeds and pop-ups, remove one at a time, and retest.
If you’ve read older articles, you may see First Input Delay, or FID. According to web.dev’s Web Vitals overview, INP replaced FID as one of the Core Web Vitals in 2024, so ignore advice that still talks about FID.
Cumulative Layout Shift: How Much The Page Jumps
You go to tap “Get a quote,” an image or banner loads above it, and you tap the wrong thing. That’s layout shift, and Cumulative Layout Shift, or CLS, measures how much of it happens. Good is 0.1 or less, needs improvement is up to 0.25, and anything above that is poor. Look for banners, cookie notices or images that appear late and push content down, and for fonts that swap size as they load.
How Google Judges The Thresholds
The thresholds above are the ones shown in Search Console’s Core Web Vitals report help page at the time of writing. One detail matters: Google judges them at the 75th percentile of real visits, measured separately for mobile and desktop. In plain English, about three out of four visits need to hit “good” for the page to pass. A page that’s fast on your home Wi-Fi can still fail if most customers visit on slower phones.
You don’t need to memorize the numbers. What matters is knowing which metric is failing, because each one points to a different kind of fix. Fixing the one that’s failing is usually a better use of your evening than chasing a perfect overall page speed score.
How Do You Test Your Detailing Website Speed?
You need two free tools. PageSpeed Insights tests any page right now. Search Console shows how your whole site performs for real visitors over time, once Google has enough data. Start with PageSpeed Insights, because it takes about ten minutes and works for a brand new site.
Run PageSpeed Insights On The Mobile Tab
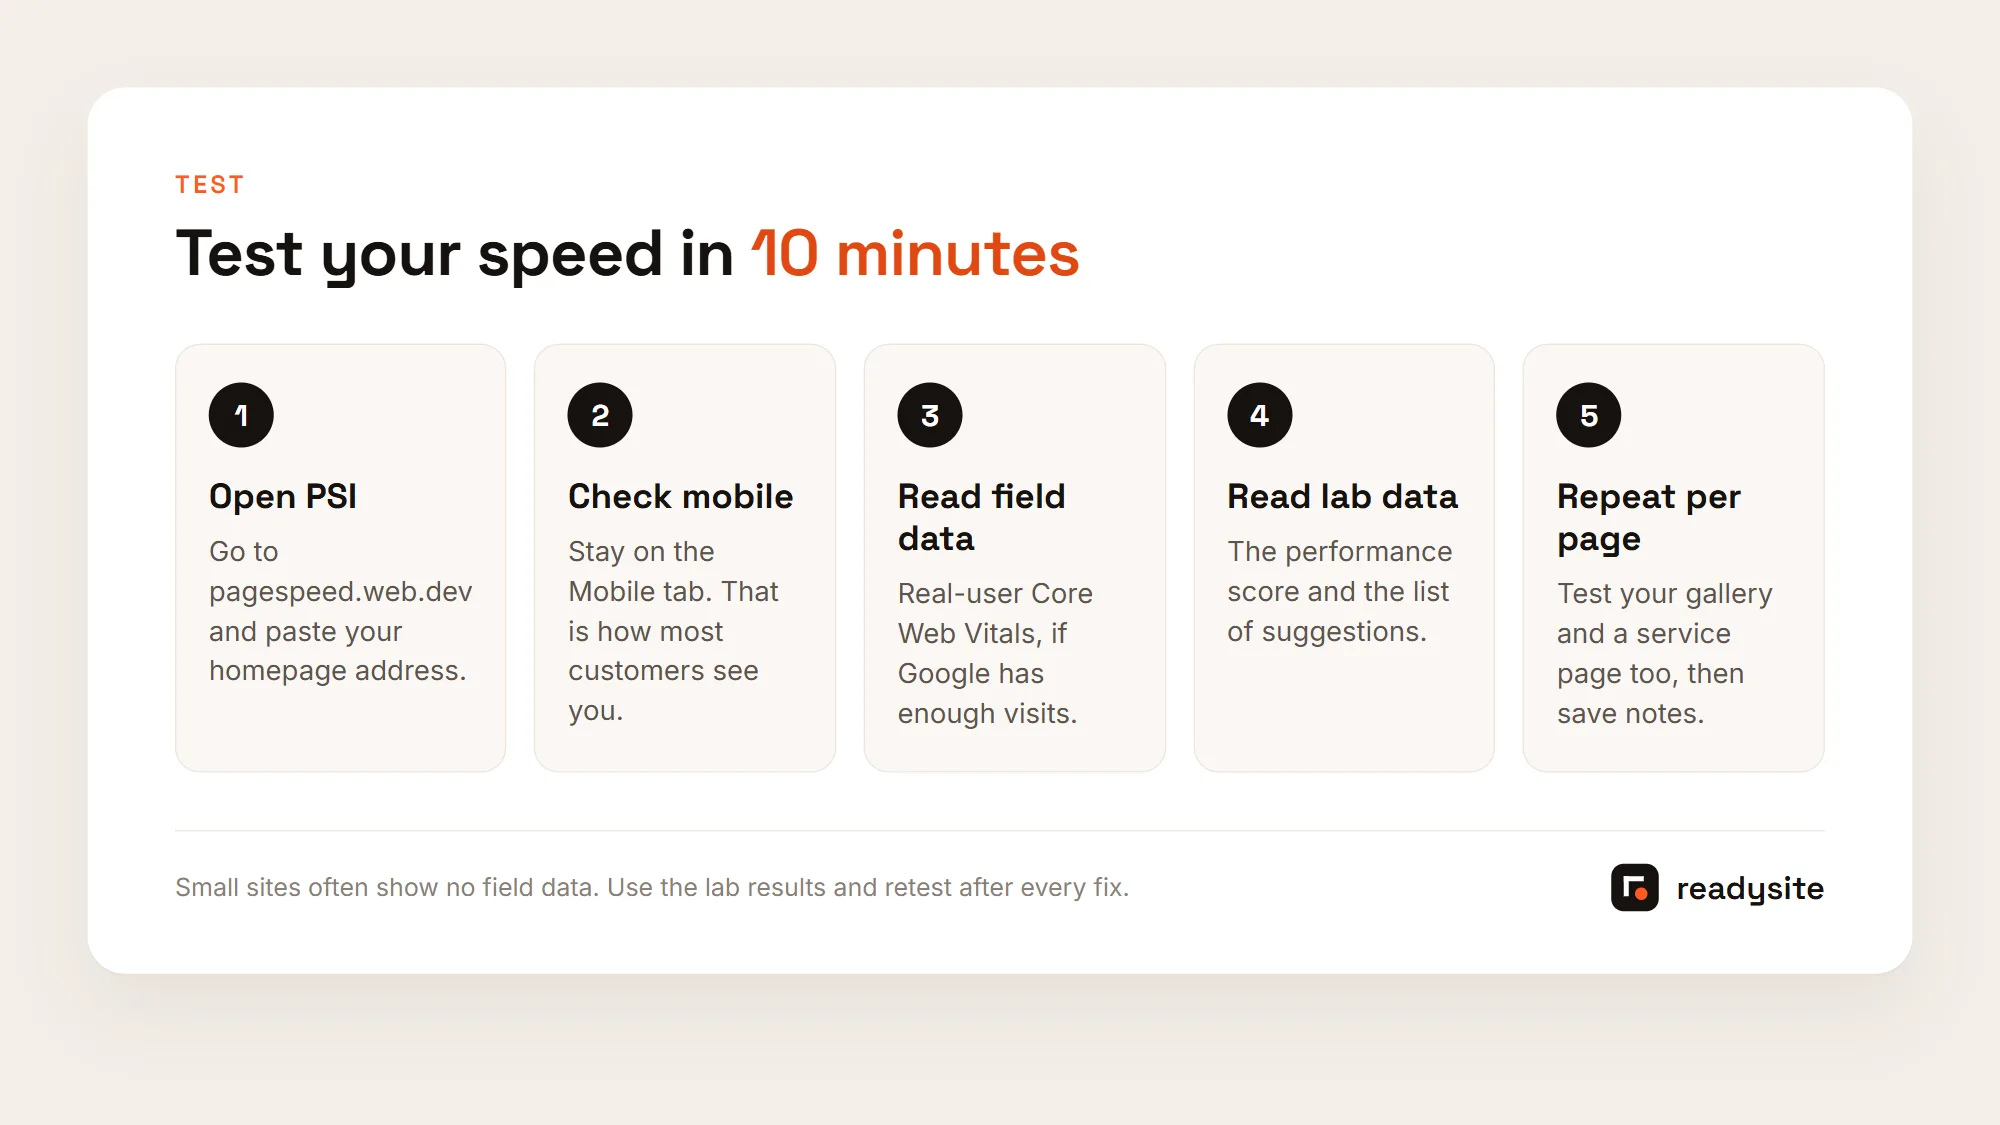
Open PageSpeed Insights, paste your page address and run it. Test your homepage, your gallery and one service page, and read the Mobile tab first, since most local customers will find you on their phones. Fixes that help mobile, like smaller photos and fewer scripts, usually help desktop as well. Write down the results for each page before you change anything, so you can see later whether your changes made a difference to detailing website speed.
Field Data Versus Lab Data
The report has two parts, and Google’s PageSpeed Insights documentation explains both. Field data comes from real Chrome users over the previous 28 days. This is the Core Web Vitals assessment. If your page doesn’t have enough visits, the tool tries data for your whole site, and if that’s not enough either, it shows no field data. That’s normal for a new or small detailing site.
Lab data is a simulated load in a controlled setting. It gives you the performance score from 0 to 100 and the list of suggestions. The docs describe 90 or above as good, 50 to 89 as needs improvement and below 50 as poor. Lab scores vary a little from run to run, so run the test two or three times and look at the general range.
Don’t Chase A Perfect Score
A detailing site with large photos may never score 100, and that’s fine. Aim to move from red to orange to green, and focus on the suggestions that mention images, unused scripts and layout shift, because those are the ones you can usually fix yourself. Real-user Core Web Vitals, when available, matter more than the lab score. A page that loads its hero photo quickly and doesn’t jump around is doing its job, even if the number isn’t perfect.
Use The Search Console Report
If you’ve verified your site in Google Search Console, open the Core Web Vitals report. It groups similar pages together, splits results into mobile and desktop, and labels each group Good, Need improvement or Poor based on its worst metric. Many small sites will see “No data available,” which happens when a property is new or there isn’t enough real-user data. Once you’ve fixed a problem, you can click to validate the fix; Google then monitors for 28 days before marking it passed.
What We Found When We Tested 30 Templates
We measured all 30 ReadySite one-page templates on October 28, 2026, using phone emulation, a slowed processor and a throttled mobile connection. The median page weighed 349 KB and loaded 11 files, the main content appeared in 1.8 seconds at the median and 3.0 seconds at worst, and none of the 30 pages shifted its layout while loading. 26 of the 30 showed a call link on the first screen. These were static files on our local copy, so treat the numbers as a fair comparison between designs, not a promise of live speed.

Testing your page speed only takes a few minutes, but it turns guesswork into a short list. Keep notes as you go: the date, what you changed and the score before and after. When you add new photos or a widget later, you’ll know what normal looks like for your site.
Images Are The Biggest Page Speed Win
Detailing sells on photos, so detailing websites are photo-heavy by nature. That’s good for trust and bad for page speed when the photos go up straight from a phone. Modern phone cameras shoot images far larger than any website layout needs, and a gallery of them can weigh more than everything else on the site put together.
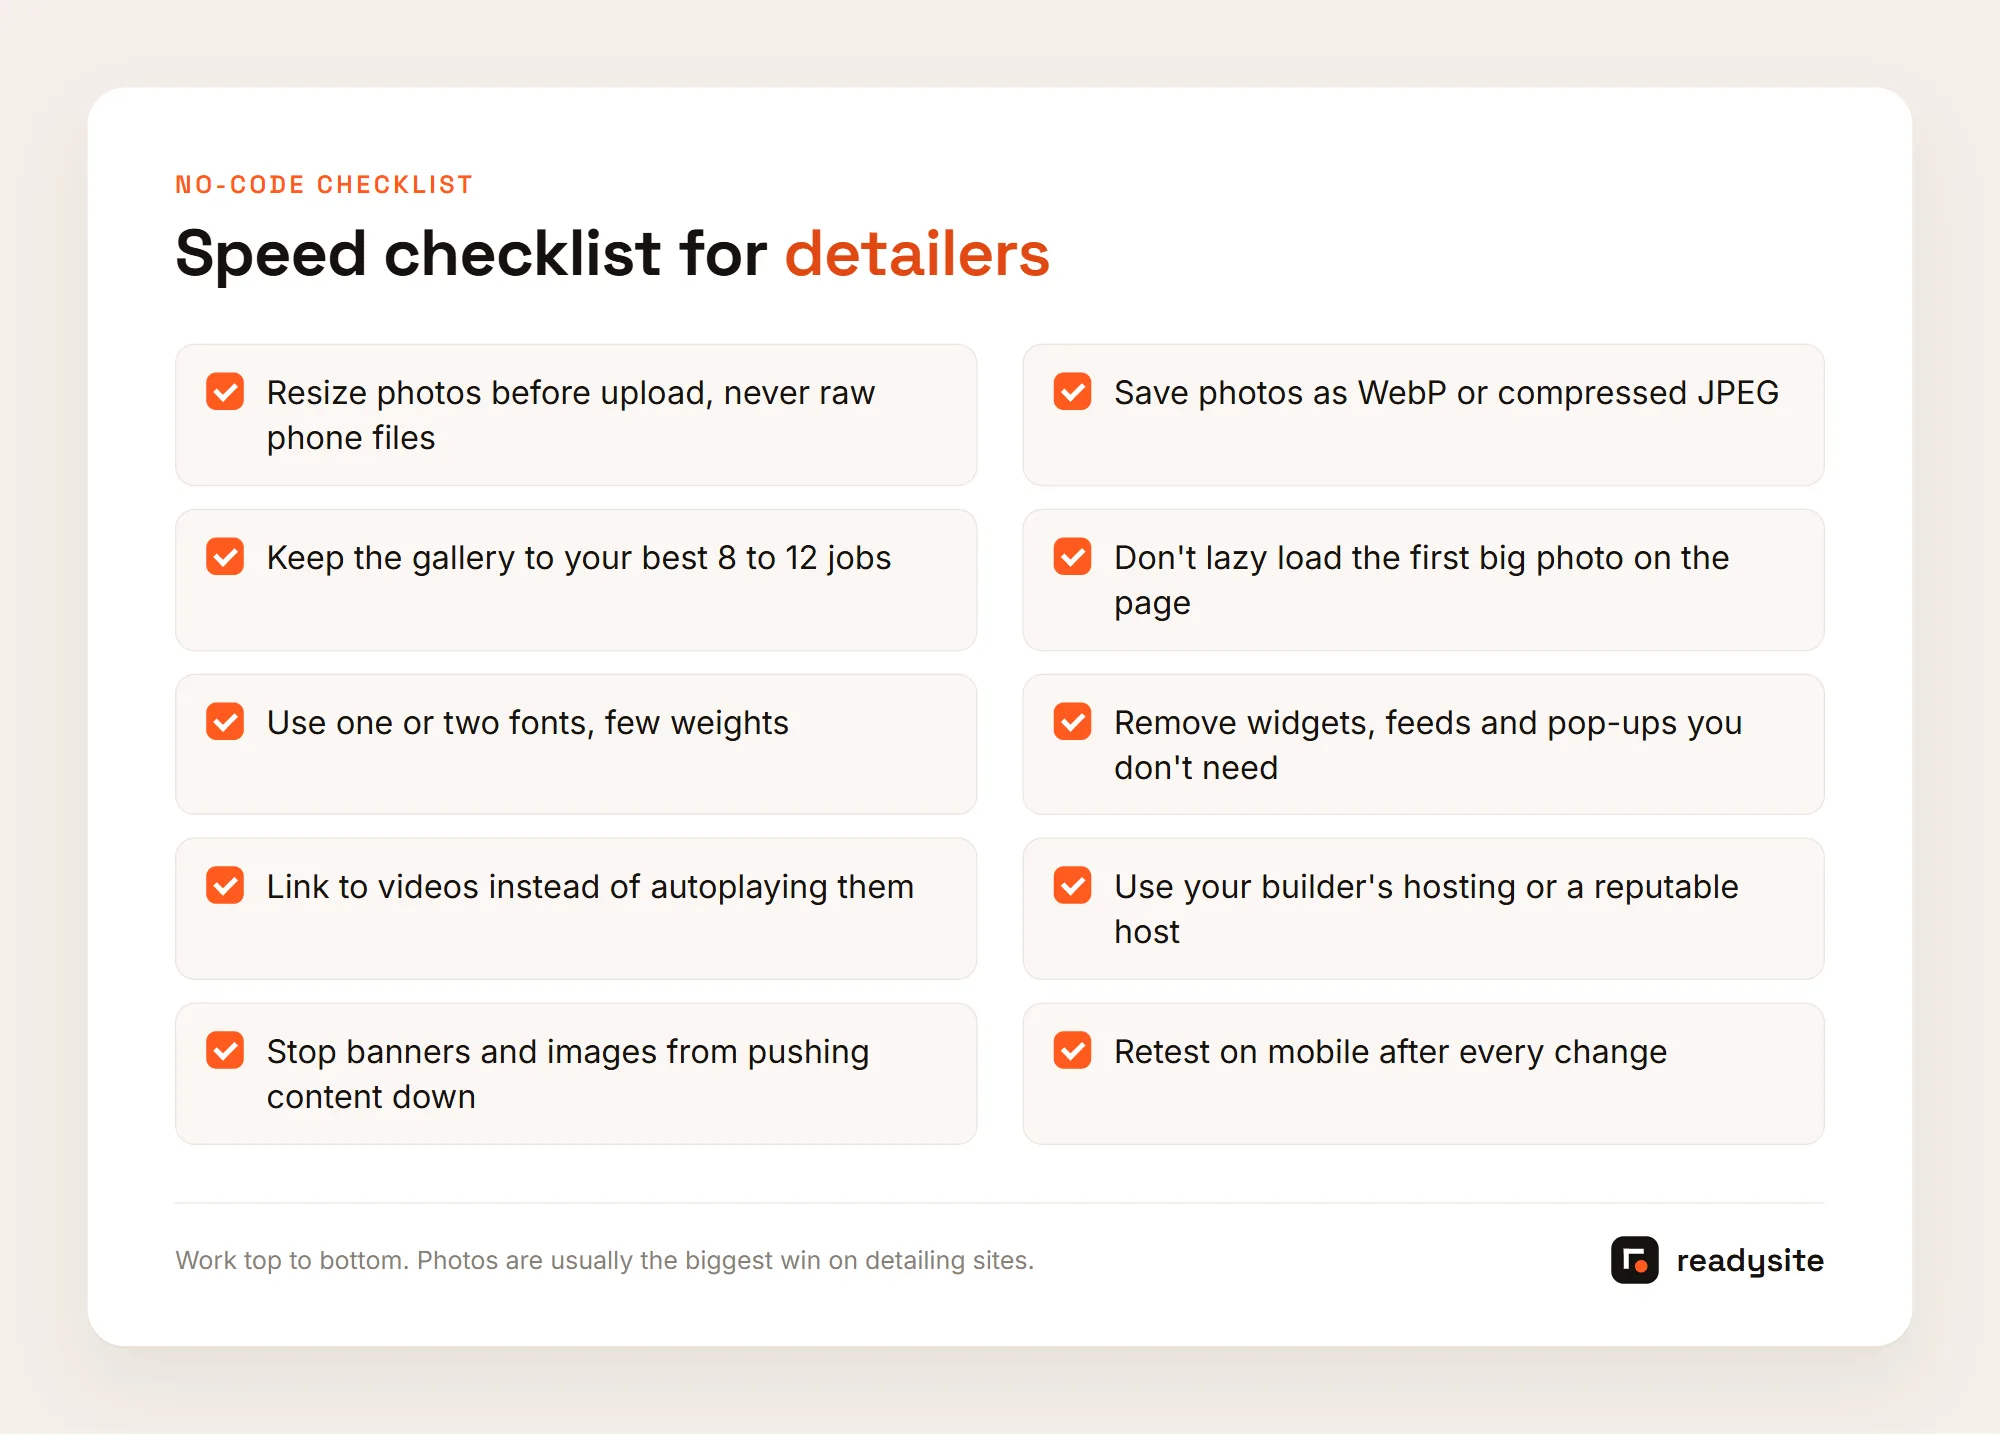
Resize Before You Upload
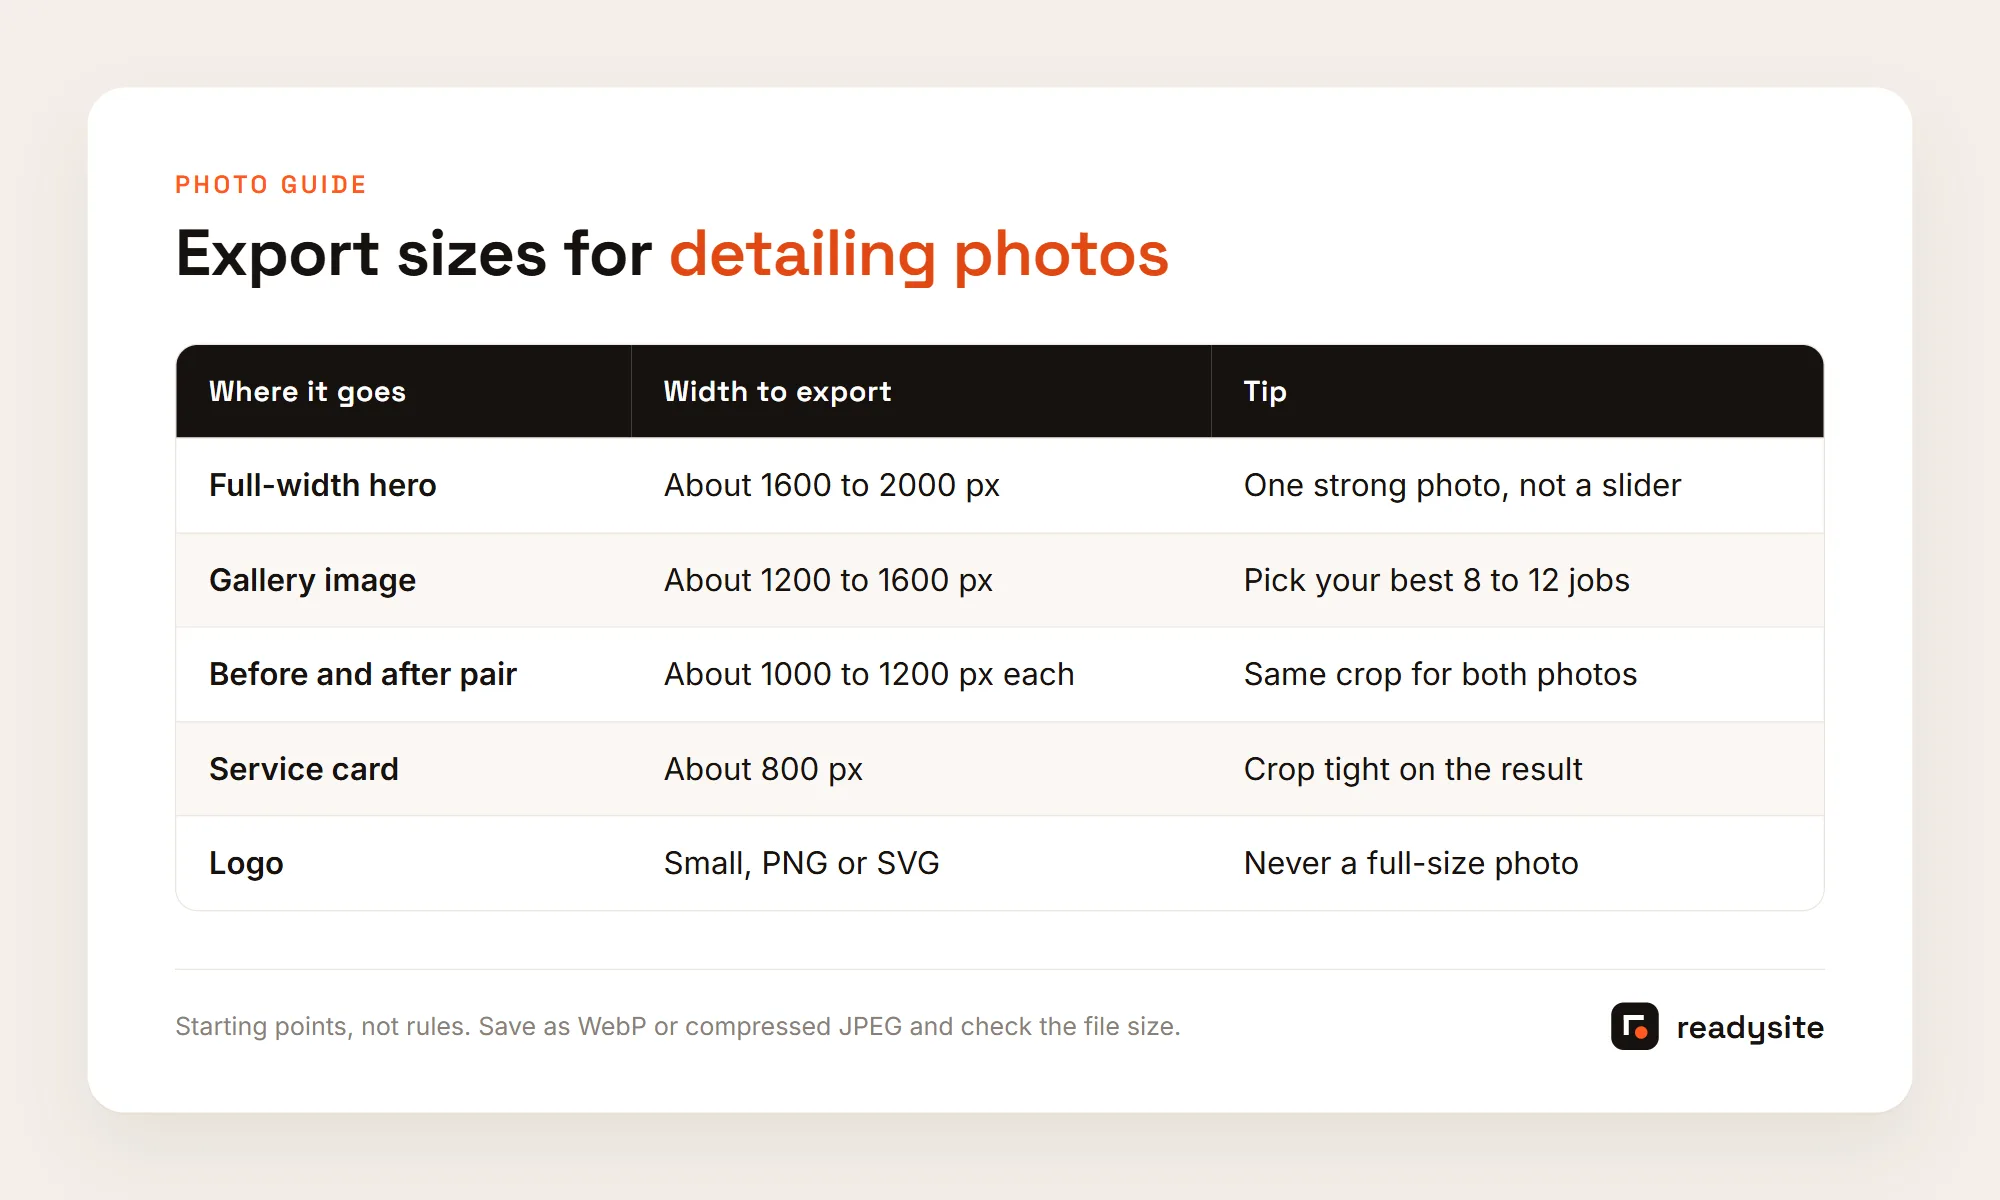
Most website layouts never show a photo wider than about 1600 to 2000 pixels, even on a large screen, and phones show far less. Export your photos at a sensible width for where they’ll appear: a hero photo needs more pixels than a small service card or your logo. Some builders resize automatically, so check your builder’s help pages. If you’re not sure, resize anyway. It never hurts, and it’s the single change that most often lifts detailing website speed on a photo-heavy site.
Compress And Use A Modern Format
Save photos as WebP where your builder accepts it, or as a well-compressed JPEG. Free tools like Squoosh in the browser, or your phone’s built-in export options, let you shrink a file a lot while it still looks sharp on a phone screen. Look at the photo at full size after compressing; if you can’t see a difference, compress a bit more. Keep your original full-size photos in a separate folder for printing and social media.
Example (illustrative): an owner’s gallery has 24 photos straight off the phone. They pick the 10 best jobs, export each at 1400 pixels wide as WebP, and replace the originals. The gallery now holds fewer, smaller files and looks just as good. Rerunning PageSpeed Insights shows whether the image warnings have gone; the exact improvement depends on the site.
Be Choosy With Before And After Galleries
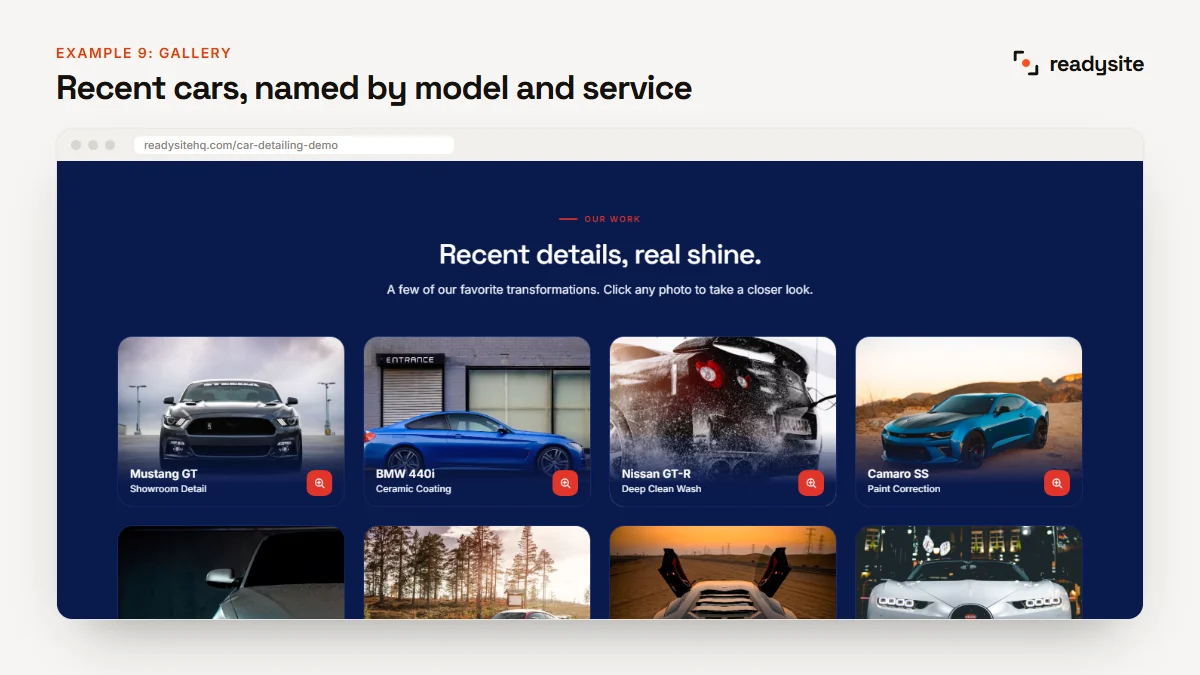
Ten great pairs usually make a stronger case than fifty average ones, and they are kinder to your page speed. Use the same crop for each before and after pair so they line up. Our guide to before and after detailing photos covers shooting angles and honest editing; this guide is about making those photos light enough for the web. A tight gallery is also easier for a customer to scroll through on a phone.
Lazy Load Everything Except The Hero
Lazy loading tells the browser to wait before loading an image until the visitor scrolls near it, so the phone doesn’t download photos nobody reaches. The rule: don’t lazy load the first big image people see. web.dev’s guide to browser-level image lazy loading advises against it for images likely to be visible when the page first loads, especially the LCP image. Many builders handle this automatically. If yours has a setting, leave it on for galleries and mark the hero as “not lazy.”
Photos are where most of your page speed effort should go. Get them right and many of the other warnings in the report shrink on their own.
Page Speed Mistakes To Avoid
After photos, the next biggest drag on detailing website speed is usually extras: things added one at a time, each harmless on its own, that together make the page heavy and slow to respond. These mostly hurt INP and CLS, two of the three Core Web Vitals.
Using A Slider For The Hero
A rotating slider loads several big images where one would do, and often adds a script on top. It also tends to push the headline and call button down while it loads. One strong hero photo with your headline, your service area and a call button is usually faster and clearer. If you love several photos, put them in the gallery further down the page, where lazy loading can do its job.
Too Many Fonts And Weights
Each font family, and each weight such as regular, bold and extra bold, is another file to download. Pick one font for headings and one for text, or even one for both, and use two or three weights. Your brand will look more consistent too. Fonts that load late can also change size as they swap in, which shows up as layout shift in your Core Web Vitals report.
Widgets And Embeds You Don’t Need
List every third-party add-on: chat bubbles, review widgets, social feeds, booking calendars, embedded maps, cookie banners, pop-ups and tracking pixels. For each one, ask whether it brings in enquiries or just sits there. A link to your Instagram is lighter than an embedded feed that loads dozens of images. A thumbnail that links to YouTube is lighter than an autoplaying video. A list of towns you serve is lighter than an interactive map, and often clearer.
Pop-ups can cause layout shift and get in the way of the call button on phones. If you can’t remove something, test with and without it in PageSpeed Insights. Seeing the difference makes the decision easier.
Ignoring Slow Hosting
Hosting is the computer that sends your site to visitors. Slow hosting drags down page speed on every page, no matter how well you’ve compressed your photos. Website builders usually include hosting set up for their own sites. On a self-managed WordPress site, a very cheap plan, a heavy theme and lots of plugins can add up. If PageSpeed Insights flags slow server response, ask your host about caching. Our guide to detailing website cost compares hosting and platform options.
Switching platforms is a big step, so try the free fixes first: photos, widgets and fonts. If speed is still poor after that, the platform or host is likely the issue. Starting fresh? You can create a free detailing website with ReadySite, add your services, area and resized photos, and test it in PageSpeed Insights before you share the link. For the same ideas applied to any trade, see our guide to fast website design.
Conclusion
Good detailing website speed comes from a short loop, not a big project. Run your homepage and gallery through PageSpeed Insights on the Mobile tab, write down the results, and check which of the Core Web Vitals is failing. Then resize your photos, cut one or two widgets you don’t need, and test again. One change, one retest, repeated until the red turns green. While you’re at it, run through our list of detailing website mistakes, since slow images sit alongside prices, tap to call and forms.
Prefer to skip the technical side? Request a free preview of a done-for-you site. For $299 one time, ReadySite builds up to 5 pages and writes the wording, and you decide whether to pay after you’ve seen it. Either way, a fast, clear page gives every customer who finds you a fair chance to see your work.
Done-for-you websites
Want your website built for you?
ReadySite writes the wording, builds up to 5 pages and sets up your Google Business Profile. $299 one time, and you see a free preview before you pay.